Programming contestsMagas szintű programozási nyelvek 1, egyéni verseny, 2012. április 22.
April 22, 2012, 10:15 AM –
April 22, 2012, 3:15 PM
|
Riemann Sums
In Integral Calculus, we study problems that can be solved by “finding the area under a curve.” That is, we have a function f mapping real numbers to real numbers, a lower bound a, and an upper bound b, and we wish to determine the area of the region bounded on the left by the line described by the equation x = a, on the right by the line described by the equation x = b, below by the x-axis (i.e., the line described by the equation y = 0), and above by the curve corresponding to the function f.
Using techniques from Calculus, we can often find this area exactly. In those cases in which we cannot, we resort to computing an approximation to the area using what is called a Riemann sum.
We proceed by choosing a positive integer m and by placing m rectangles side by side, each of width ∆x = (b − a) / m, between the lines x = a and x = b. (Hence, the left edges of the rectangles lie on the lines x = a, x = a + ∆x, x = a + 2∆x, x = a + 3∆x, etc.) The height of each rectangle is chosen so that its upper left corner is a point on the curve. We then calculate the sum of the areas of the rectangles, which provides us with an estimate of the area of the region of interest. (Generally speaking, the larger the value of m that we choose, the better we expect the estimate to be.)
As an example, see the figure below, in which a = 0, b = 16, m = 8, and f is given by the graph.
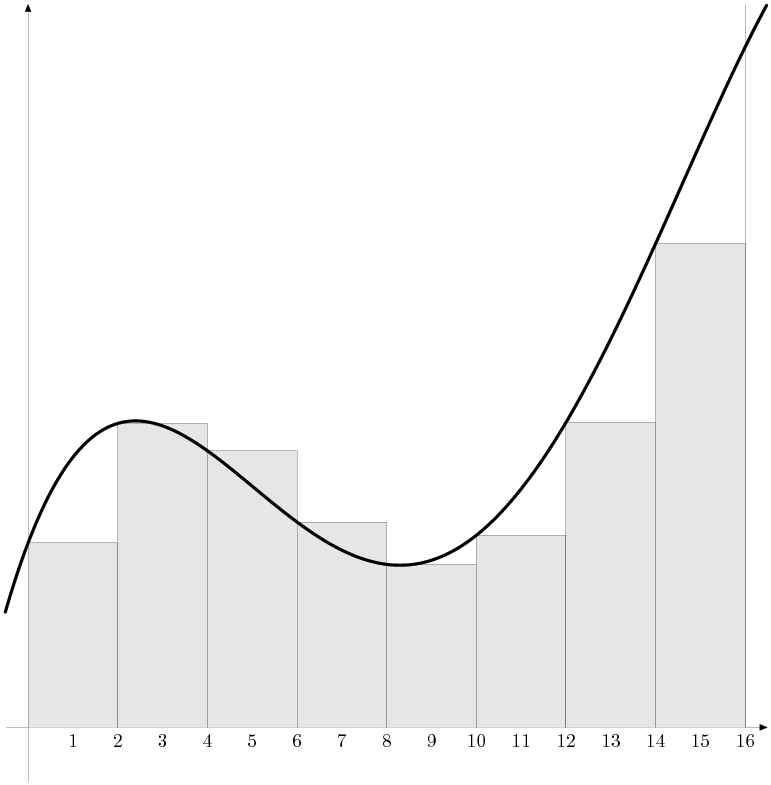
Figure 1: Estimating the Area Under a Curve by a Riemann Sum
Develop a program that, given real numbers a and b (with a < b), a positive integer m, and a description of a polynomial p (satisfying p(x) ≥ 0 for all x ∊ [a, b]) estimates the area of the region bounded by x = a on the left, x = b on the right, y = 0 below, and p above, using the method described above.
Note that a polynomial p(x) is simply a function that can be expressed by
for some k ≥ 0 and real numbers (called coefficients) c0, c1, …, ck. We say that k is the degree of p.
Input Specification
The first line contains a positive integer n indicating the number of regions whose areas are to be estimated. On the following n lines are described the regions, one per line. Each one is described by real numbers a and b (the lower and upper bounds, respectively), a positive integer m (the number of rectangles to use in calculating the estimate of area), a nonnegative integer k (the degree of the polynomial), and the k + 1 coefficients of the polynomial, beginning with c0 and ending with ck.
Output Specification
For each region described, produce as output a two-line message identifying the polynomial, the bounds, the number of rectangles used in calculating the estimate of area, and the estimate itself. All real numbers should be displayed with exactly one decimal digit after the decimal point. See the sample output below for the expected format. Put a blank line after each message.
Sample Input
30.0 4.0 4 1 0.0 2.00.0 4.0 8 1 0.0 2.0-3.0 1.0 4 2 2.0 0.0 1.0
Output for Sample Input
Estimated area under y = 0.0x^0 + 2.0x^1between x = 0.0 and x = 4.0 using 4 rectangles is 12.0Estimated area under y = 0.0x^0 + 2.0x^1between x = 0.0 and x = 4.0 using 8 rectangles is 14.0Estimated area under y = 2.0x^0 + 0.0x^1 + 1.0x^2between x = -3.0 and x = 1.0 using 4 rectangles is 22.0